
I’m writing this from a lakeside terrace, reading through another wave of LinkedIn posts about “the best tool to detect your GPU and run the perfect local AI model.” My Cane Corso is lying next to me. She’s not impressed either.
Let me be direct: the GPU detector tools everyone is sharing are solving the wrong problem.
Your VRAM Is Busy Looking Pretty. The Bandwidth Is Playing Cards.
Everyone looks at VRAM. CUDA cores. Benchmark scores on synthetic workloads.
Nobody talks about memory bandwidth.
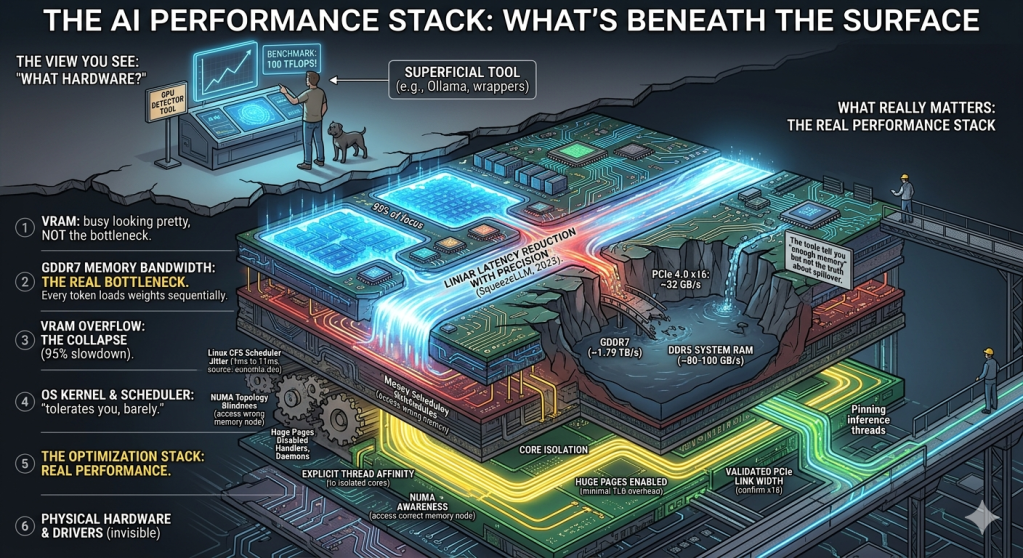
Here’s the uncomfortable truth: LLM inference during token generation is not compute-bound. It’s memory-bandwidth-bound. Every single token generated requires loading model weights from memory into the processing cores — repeatedly, sequentially, with no shortcut.
The research is unambiguous. A 2023 paper from Berkeley (SqueezeLLM, arxiv:2306.07629) demonstrated it cleanly: on an A5000 GPU, reducing bit precision linearly reduced latency — not because computation got faster, but because less data had to move. The compute units were already waiting. The bottleneck was the pipe, not the engine.
A 2025 paper on vLLM inference confirmed that even with high-end hardware, the XFormers attention kernel achieves only 23% compute bandwidth utilization and 47% memory bandwidth utilization (arxiv:2504.06319). Your GPU is half-idle. It’s waiting for data that the memory subsystem can’t deliver fast enough.
It Doesn’t Slow Down. It Collapses. There’s a Difference.
The VRAM overflow scenario is where “slower” becomes “unusable.”
When your model doesn’t fit in VRAM and spills to system RAM, performance doesn’t degrade gracefully. It collapses. We’re talking about going from 50–100 tokens/second to 2–5 tokens/second. That’s not a 20% slowdown. That’s a 95% collapse.
Why? Because the bandwidth gap is enormous:
- GDDR7 (RTX 5090): ~1.79 TB/s
- DDR5 system RAM: ~80–100 GB/s
- PCIe 4.0 x16 bridge between them: ~32 GB/s
The moment your model spills across that PCIe bridge, you lose a full order of magnitude. And the GPU detection tools? They’ll tell you “you have enough memory.” They won’t tell you what happens when it doesn’t fit.
A clarification worth making: partial GPU offloading — as implemented in llama.cpp — is not the same as chaotic PCIe thrashing. Frameworks like llama.cpp load offloaded layer weights into VRAM once at startup, then transfer only activation tensors during inference. Those are orders of magnitude smaller than the weights themselves. Offloading 20 out of 32 layers to a GPU is almost always dramatically faster than running all 32 on CPU. The collapse described above applies to the case where the model exceeds total available memory and the system starts retrieving weights dynamically — not to intelligent partial offloading. The tools won’t tell you the difference. You need to know it yourself.
The Kernel Tolerates You. Barely.
This is where nobody looks. And it’s where some of the most significant overhead lives.
Your general-purpose OS is designed for fairness and interactive latency — not sustained inference throughput. Those are fundamentally different optimization targets.
Linux’s default CFS scheduler will interrupt your inference threads to maintain scheduling fairness across all processes. Background daemons, IRQ handlers, kernel housekeeping — all of them compete for CPU time. Measurements in high-performance inference settings show that without explicit tuning, 1 in 100 scheduling events can be delayed by over 2 milliseconds, with worst-case delays reaching 11ms (High Scalability, via eunomia.dev, Feb 2025).
The practical impact depends heavily on your use case. For a single local user with the model fully in VRAM, the CPU mostly launches CUDA kernels asynchronously — scheduler jitter introduces micro-stuttering in time-to-first-token, not a collapse in decode throughput. Where CFS tuning genuinely matters is in production serving: vLLM handling hundreds of concurrent requests, where KV cache management, attention coordination, and CPU-side tensor operations all compete for scheduling time simultaneously. If you’re running a local assistant, the kernel scheduler is not your primary bottleneck. If you’re running inference infrastructure, it absolutely is.
The fix exists: CPU core isolation, explicit thread affinity, pinning inference threads to dedicated cores away from normal scheduling. With proper isolation, worst-case latency drops to tens of microseconds. That’s a 500x improvement — from software configuration, not hardware purchase.
Other OS-level factors that compound the problem:
- NUMA topology blindness — on Ryzen chiplet architectures or multi-socket systems, your process may silently read from the wrong memory node, adding latency you’ll never see in any GPU monitoring tool
- Huge pages disabled by default — TLB pressure from standard 4KB pages adds measurable overhead when you’re moving multi-gigabyte weight tensors
- Swap and memory compression active — the kernel can decide to compress or swap model weight pages at the worst possible moment
- Windows WDDM driver model — an additional abstraction layer between your application and the GPU that WDDM 3.x reduced but did not eliminate
What You Think Is Happening vs. What Is Actually Happening
Most people visualize local AI inference as: Model → GPU → Output.
The actual stack looks like this:
Every layer has its own overhead. ollama is convenient — it’s also a wrapper that adds latency compared to calling llama.cpp directly. The BLAS libraries behave differently depending on how they were compiled and for which microarchitecture target. FlashAttention2 versus naive attention kernels can produce 2–4x throughput differences — but this matters primarily during the prefill phase, when the model processes your initial prompt, or in high-concurrency production serving with large batch sizes. During autoregressive decode at batch size 1 — the case for virtually every local inference tool — attention is dominated by the memory wall of loading the KV cache, not by compute. The kernel choice matters less than the bandwidth available to feed it.
The tools that “detect your GPU” operate at the top of this stack. They measure what’s visible. They don’t measure what matters.
Detection Is the Easy Part. Pity It’s Not the Hard Part.
The GPU detection tools ask: “What hardware do you have?”
The question you should be asking is: “Is this system configured to actually use that hardware efficiently?”
On a default consumer Linux install running a desktop environment, background services, and a browser — the answer is almost certainly no.
Running local AI inference seriously means treating the system like a production server: explicit process isolation, memory lock configuration, huge pages enabled, NUMA awareness, thermal management verified, PCIe link width confirmed (many consumer boards negotiate x8 instead of x16 silently, cutting your available bandwidth in half with zero warning).
None of that requires better hardware. All of it requires knowing what you’re actually doing.
It Optimized the Install. The Runtime Didn’t Get the Memo.
Fair objection. They exist. Ubuntu, Pop!_OS, Fedora AI — all position themselves as AI-friendly. And they do solve real problems: CUDA drivers pre-installed, Python environments preconfigured, dependency hell reduced.
That’s tooling convenience. It’s not the same thing as system-level optimization.
Running Fedora instead of Windows gives you roughly 20% faster inference in some benchmarks — real, measurable, worth doing. But 20% is noise compared to what you lose from an untuned scheduler or a VRAM overflow event. The CFS scheduler behaves identically on every standard Linux distribution. Huge pages are disabled by default on all of them. NUMA topology blindness doesn’t care which distro you chose. PCIe link width negotiation happens at the hardware level, invisible to every installer.
The “AI-optimized OS” category, as it exists today, optimizes the setup experience. The runtime environment is still general-purpose. Those are different problems, and only one of them is being solved.
The Next Time You See One of Those Posts
The next time you see a post about a tool that “automatically detects your GPU and picks the best model” — ask yourself what it knows about your kernel scheduler, your memory bandwidth under load, your PCIe negotiated width, and your NUMA topology.
If the answer is nothing, the tool is telling you half the story. And the half it’s not telling you is the half that actually determines whether your inference runs at 80 tokens/second or grinds to 3.
Better hardware won’t fix a misconfigured system. Understanding the stack will.
A Note on How This Was Written
I structured this article at the park, on my phone, with ideas accumulated over years of working with inference pipelines in production environments. The reasoning, the critical angle, and the technical positions are mine.
The drafting, structuring, and verification of cited sources was done in collaboration with Claude (Anthropic). I asked it to challenge my thinking, verify the claims against published research, and produce something worth reading rather than something worth skimming.
I think that’s a legitimate use. Pretending otherwise would be dishonest — and dishonesty is not a habit I want to build into my workflow.
The sources cited are real. The papers are real. The numbers are real. Check them.